Setting up Uptime Kuma - Self Hosted Monitoring tool
If you're looking for a simple and effective way to monitor your systems, you might want to check out Uptime Kuma. Uptime Kuma is a free and open-source self-hosted monitoring tool that allows you to monitor the uptime and performance of your websites, servers, and services.
Choosing the Deployment Type/Location
There are two main options:
- cloud-based deployments
- home lab deployments
Cloud-based deployment
This option is ideal for those who want a hassle-free and scalable solution. You can take advantage of the reliability, security, and performance of cloud providers. You don't have to worry about maintaining your own hardware or network infrastructure, and you can easily scale up or down your resources as needed. However, this option also comes with some drawbacks, such as higher costs, less control, and potential privacy issues. Here are some cloud providers you can choose from. You can use the links below to get free trials on any of the cloud providers.
- Vultr - Get 100 USD in credits to try out in 30 days. Vultr also offers Windows Server VPSs at a cheaper cost and has tones of other operating systems to choose from as compared to Linode and Digital Ocean
- Digital Ocean - Get 200 USD in credits to try out in 60 days!
- Linode - Get 100 USD in credits to try out in 60 days!
- Microsoft Azure
- AWS
- Google Cloud Platform
Home lab deployment
This option is suitable for those who enjoy tinkering with their own hardware and software. By deploying Uptime Kuma in your home lab, you can have full control over your monitoring environment. You can customize your settings, tweak your configurations, and experiment with different features. You also have more privacy and security, as your data is stored locally on your own devices. However, this option also has some challenges, such as lower reliability, higher maintenance, and limited scalability and complexity especially if you want to expose the services externally.
Setting Up Uptime Kuma
Setting up an account in the cloud
To get started, you'll need to create an account on the cloud provider of your choice, account If you don't have one already. You can sign up for a free trial on Vultr , Digital Ocean , Linode or the big three ( AWS, Azure or GCP). The point is to have a provide that will give will allow you to deploy a server with root level access. So whatever you choose does not matter that much unless you are interested in VPS providers that boast of privacy and anonymity.
Deploying uptime Kuma using Docker
The following steps assume you already have an account setup on the cloud and have a VPS running. The steps apply for both cloud deployments on a VPs and home lab deployments with a few differences which will be highlighted in the instructions.
You'll need Docker and Docker Compose set up on your server. Docker is a software that allows you to run applications in isolated containers, while Docker Compose is a tool that allows you to define and run multiple docker containers using a YAML file. Docker can be run anywhere, including on servers provisioned on a different cloud platform, regardless of the distribution of Linux. We will however install Docker and Docker Compose on Ubuntu 22.04 LTS, but you can follow similar steps for other operating systems. Uptime Kuma allows you to deploy and run it without using docker compose as described in the documentation, bit we will be using docker compose in our case.
Installing Docker and Docker Compose
To install Docker on Ubuntu 22.04 LTS, follow these steps:
- Update your package index by running this command in your terminal:
sudo apt update
- Install some dependencies by running this command:
sudo apt install apt-transport-https ca-certificates curl gnupg lsb-release
- To install Docker and docker-compose, run the following command:
sudo apt install docker.io docker-compose
- Verify that Docker is installed and running by running this command:
sudo docker run hello-world
You should see a message that says "Hello from Docker!". You can also verify that docker compose has been installed using the following command.
docker-compose --version
You should see the version number of Docker Compose.
Here are the official installation instructions for your operating system:
- Debian/Ubuntu: https://docs.docker.com/engine/install/debian/ and https://docs.docker.com/compose/install/
- CentOS/RHEL: https://docs.docker.com/engine/install/centos/ and https://docs.docker.com/compose/install/
- Raspberry Pi: https://phoenixnap.com/kb/docker-on-raspberry-pi
Configuring Uptime Kuma with Docker Compose
Now that you have Docker and Docker Compose installed, you can configure Uptime Kuma using a Docker Compose file. A Docker Compose file is a YAML file that defines the services, networks, and volumes that make up your application. In this case, we'll use a simple Docker Compose file that creates a service for Uptime Kuma and a service for MongoDB, which is the database that Uptime Kuma uses to store its data.
To configure Uptime Kuma with Docker Compose, follow these steps:
- Create a directory for your project by running this command:
mkdir uptime-kuma && cd uptime-kuma
- Create a file named docker-compose.yml. Use whatever text editor you fancy. I will be using nano:
nano docker-compose.yml
- Paste the following content into the file. This is from the official uptime-kuma GitHub repository with a few changes.
version: '3.8'
# Simple docker-compose.yml
# You can change your port or volume location

services:
  uptime-kuma:
    image: louislam/uptime-kuma:1
    container_name: uptime-kuma
    volumes:
      - uptime-kuma-data:/app/data
    ports:
      - "3001:3001"  # <Host Port>:<Container Port>
    restart: always

volumes:
  uptime-kuma-data:
This file tells Docker Compose to pull the latest Uptime Kuma image from Docker Hub, name the container as uptime-kuma, restarts it automatically if it crashes, expose port 3001 to the host, and mount the data directory to the container.
Create the data directory defined in the compose file:
mkdir uptime-kuma-data
You can modify the file according to your needs, such as changing the port number, the image tag, or the volume path. For example, you can the following under services to prevent the application processes inside the container from gaining new privileges during execution.
security_opt:
     - no-new-privileges:true
You can check out complete docker and docker compose lessons for the following books:
- Docker in Action (Amazon Affiliate Link)
- Learning Docker (Amazon Affiliate Link)
Save and exit the file and then run the following command to start Uptime Kuma:
docker-compose up -d
It will take a few seconds for the containers to start. You can check the status of the containers by running this command:
docker-compose ps
You should see a container named uptime-kuma with a state of Up. You can also view the logs of the service by running:
docker-compose logs -f
To stop Uptime Kuma, you can run:
docker-compose down
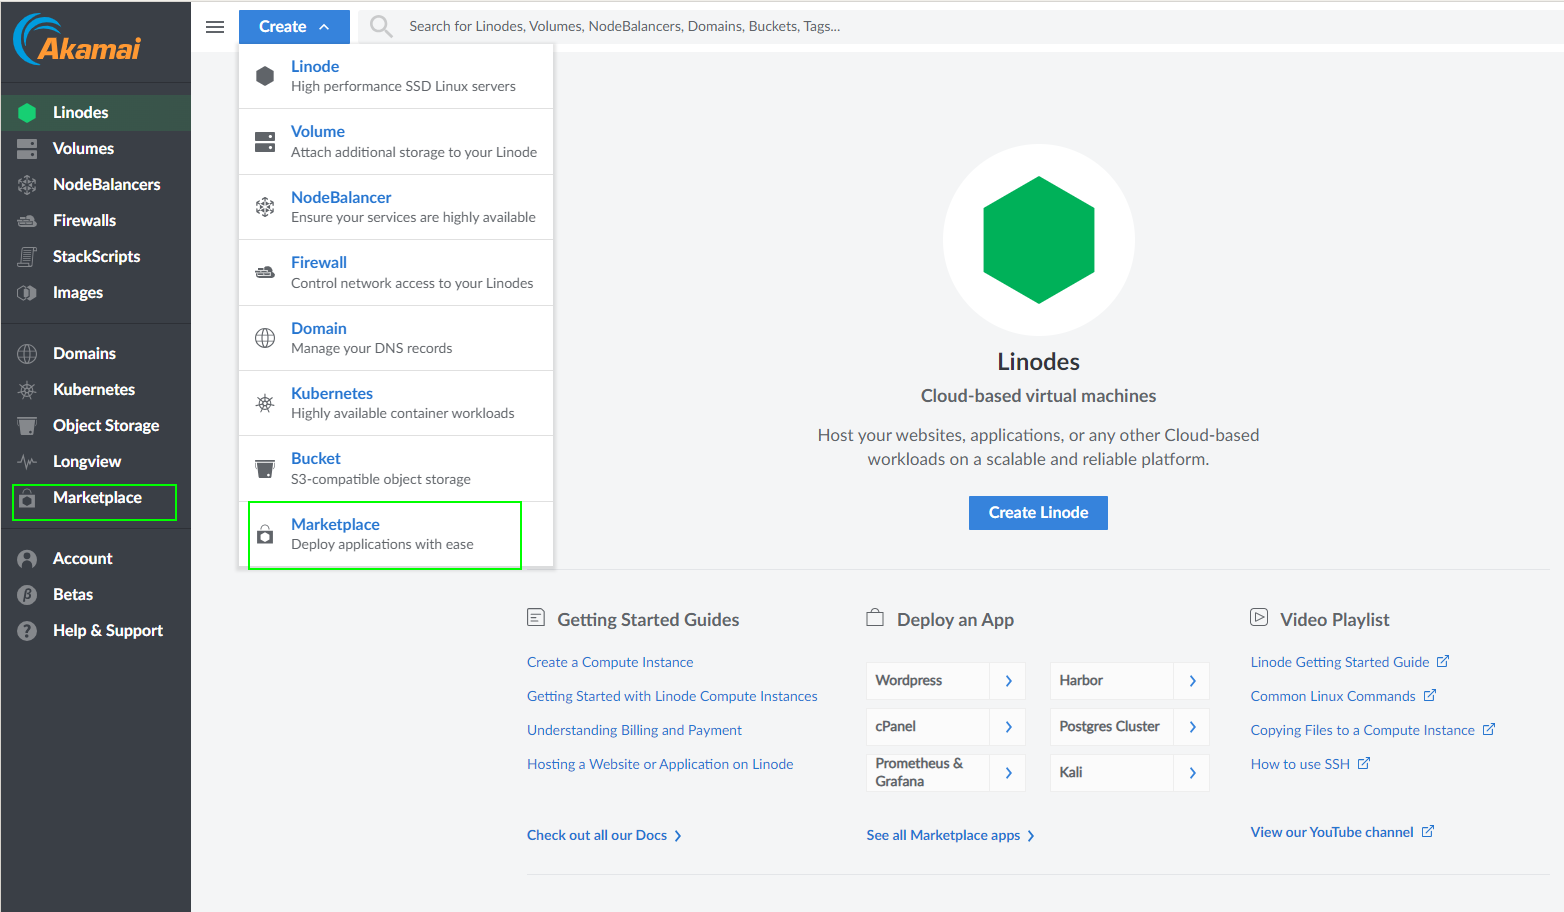
Deploying Uptime Kuma on Linode
If you want to make the process easier and convenient, you can deploy Uptime Kuma on Linode using the marketplace. The marketplace contains images that are already built with the intended software already installed.
- Signup or Log in to your Linode account and click on the "Create" button at the top right corner and select "Marketplace" from the menu. You can also select "Marketplace" directly from your left menu.
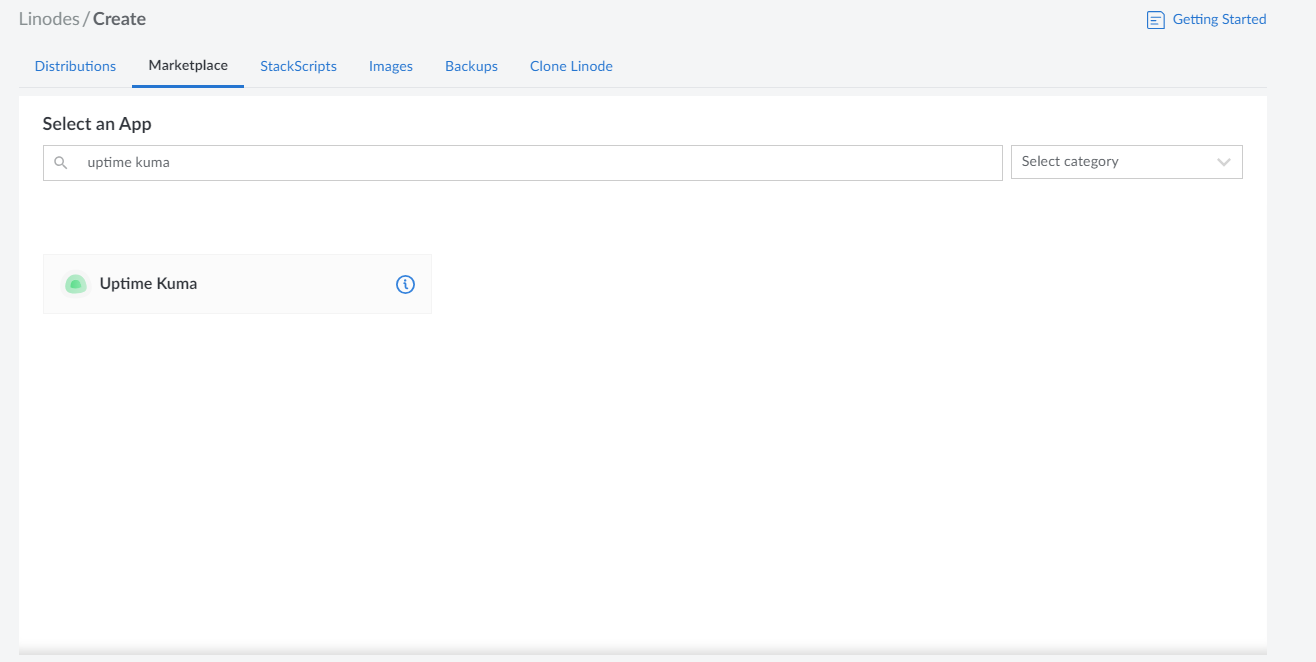
- Search for "Uptime Kuma" in the search bar and click on it.
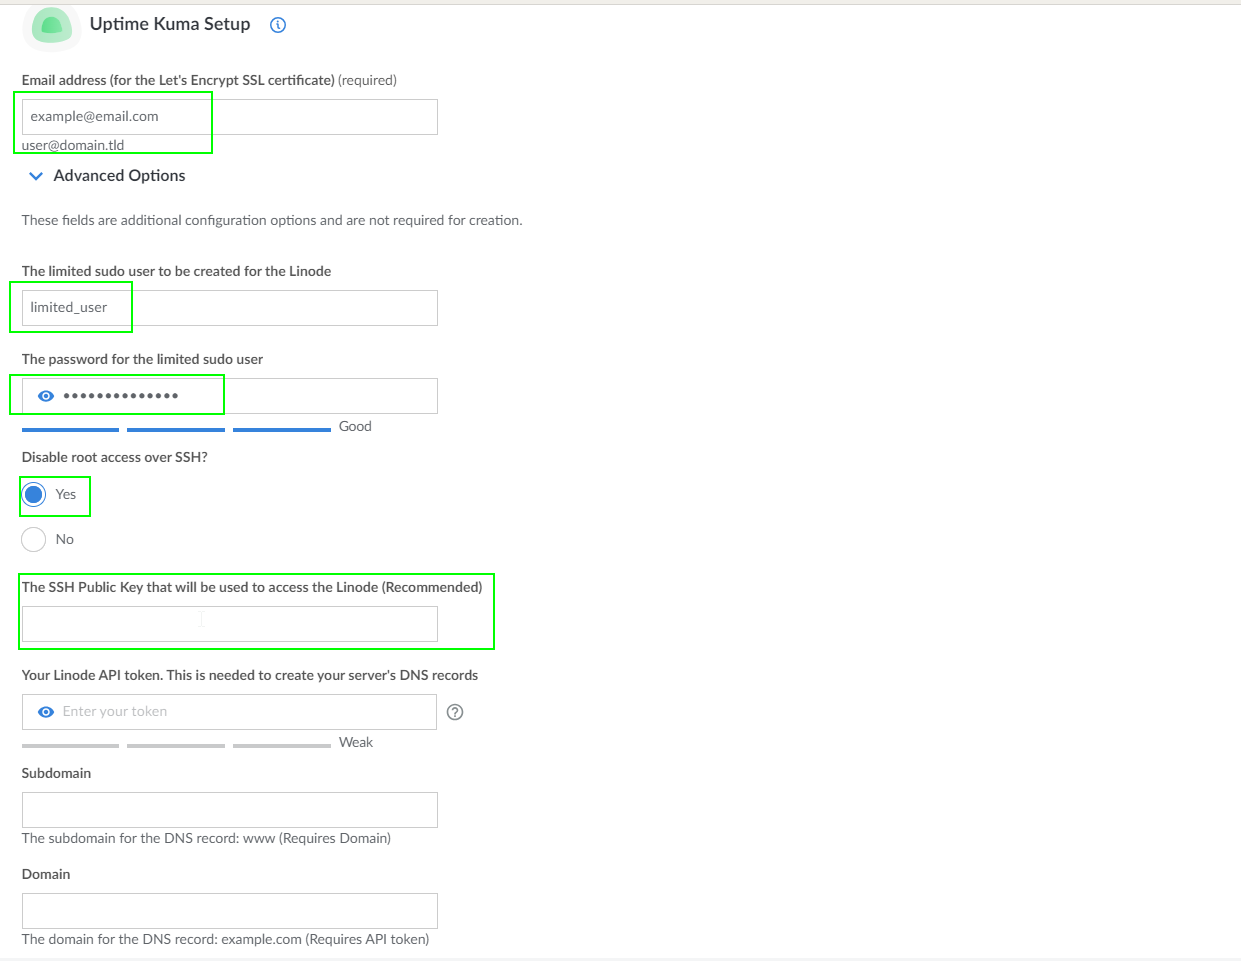
- Once selected, you will need to supply an email address that will be used to get an SSL certificate from Let's Encrypt SSL certificate. While optional, it is also recommended to create a limited sudo user and disable root access over SSH for security purposes.
- Choose a password for your user. Preferably, you need to add some additional configurations, such as SSH keys, backups, tags, for best security practices. SSH passwords are prone to brute force attacks.
- You can configure the domain settings as well using the Linode API key. This is an optional step and so we can skip it. You can find full details on how to configure this in the full guide
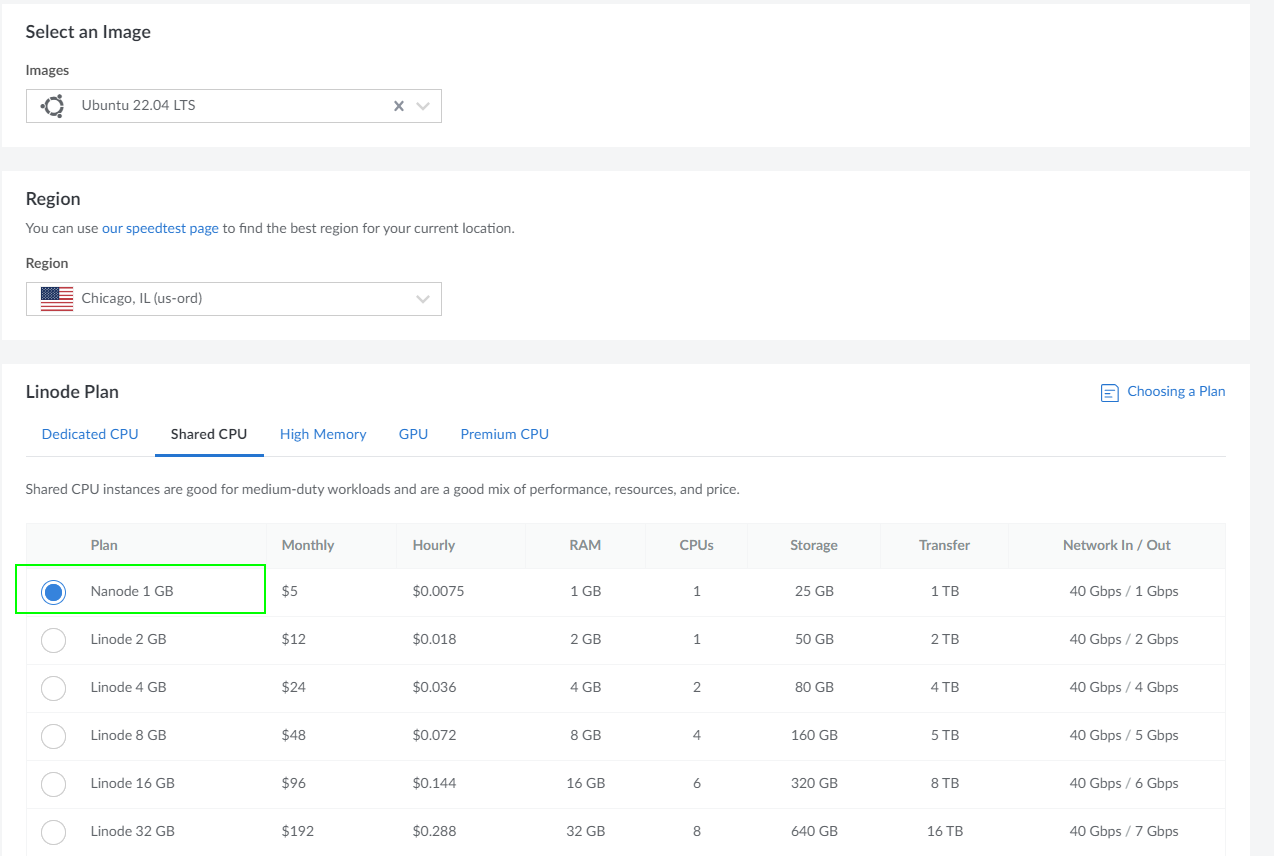
- Choose a region where you want to deploy Uptime Kuma. Ideally, you should choose a region that is close to your location to reduce the latency.
- Choose a plan that suits your needs and budget. For Uptime Kuma, you don't need a very powerful server, so you can start with the Nanode 1GB plan for $6/month.
- You will be required to provide a password for the root user, in as much as it is diabled. You will also select the SSH key you will be using or can create one, using the guide provided by Linode.
- Complete the creation of the linode.
It will take a few minutes for Linode to provision your server and install Uptime Kuma on it and you'll see a green checkmark next to your server name when the process is complete. Once complete, you can access your linode using the IP address on https or via the Compute Instance’s rDNS domain (such as 192-0-2-1.ip.linodeusercontent.com). Here is the guide on how to get the rDNS of your VPS on linode. If you set up the custom domain, you can access yur caprover dashboard via https://DOMAIN/, where DOMAIN will be replaced with the custom domain.
Deploying Uptime Kuma using Caprover
You can also deploy uptime kuma as a one click app via an app/database deployment & web server manager like Caprover. Deployment is simple once Caprover has been installed. Here is a full guide on how to set up Caprover.
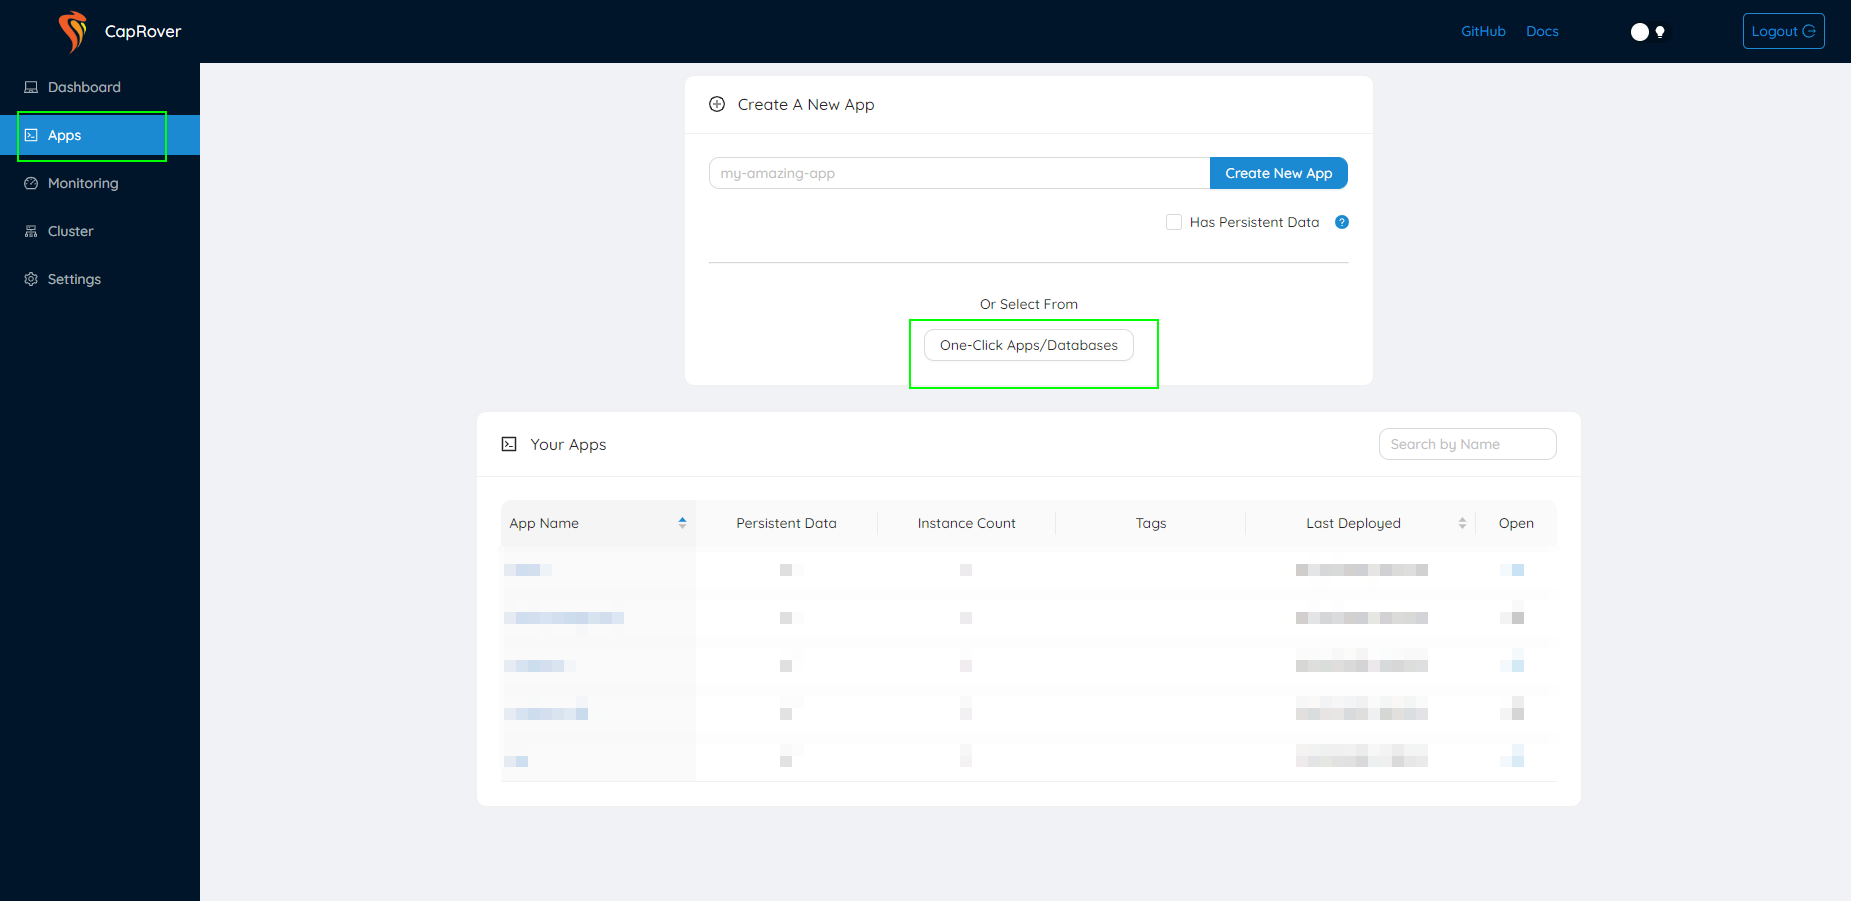
- Once installed, navigate to the apps, and then select One Click-Apps/Database
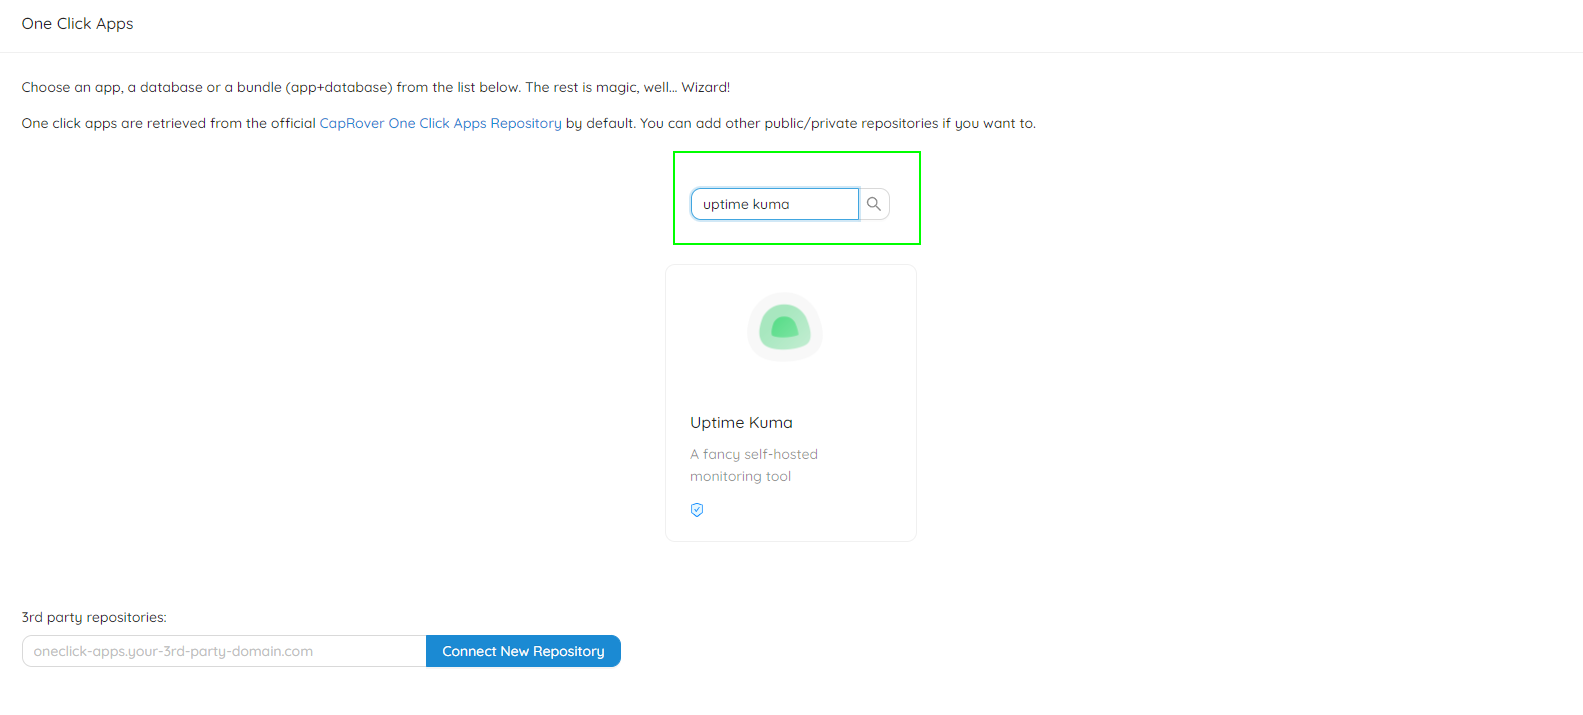
- Search for uptime kuma among the many applications and select it
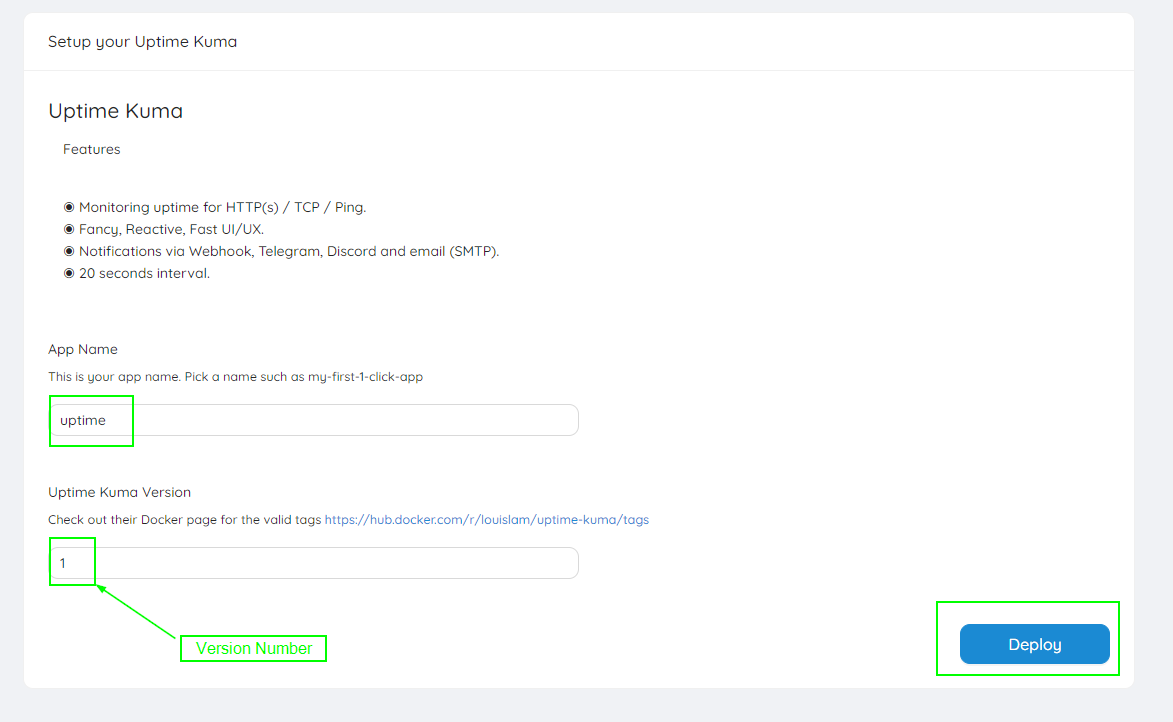
- Give it a name that will help you recognize it among the different apps that will be hosted on your Caprover manager. Note that the name you give it will be part of the domain name you will use to access the application. This is the domain that you set up initially during the caprover setup. Follow the guide here.
- For the version number, you can use 1 if you want the latest version available on dockerhub or you can use a specific version number if you like. The developers always make sure that the version with tag of 1 has the latest version available.
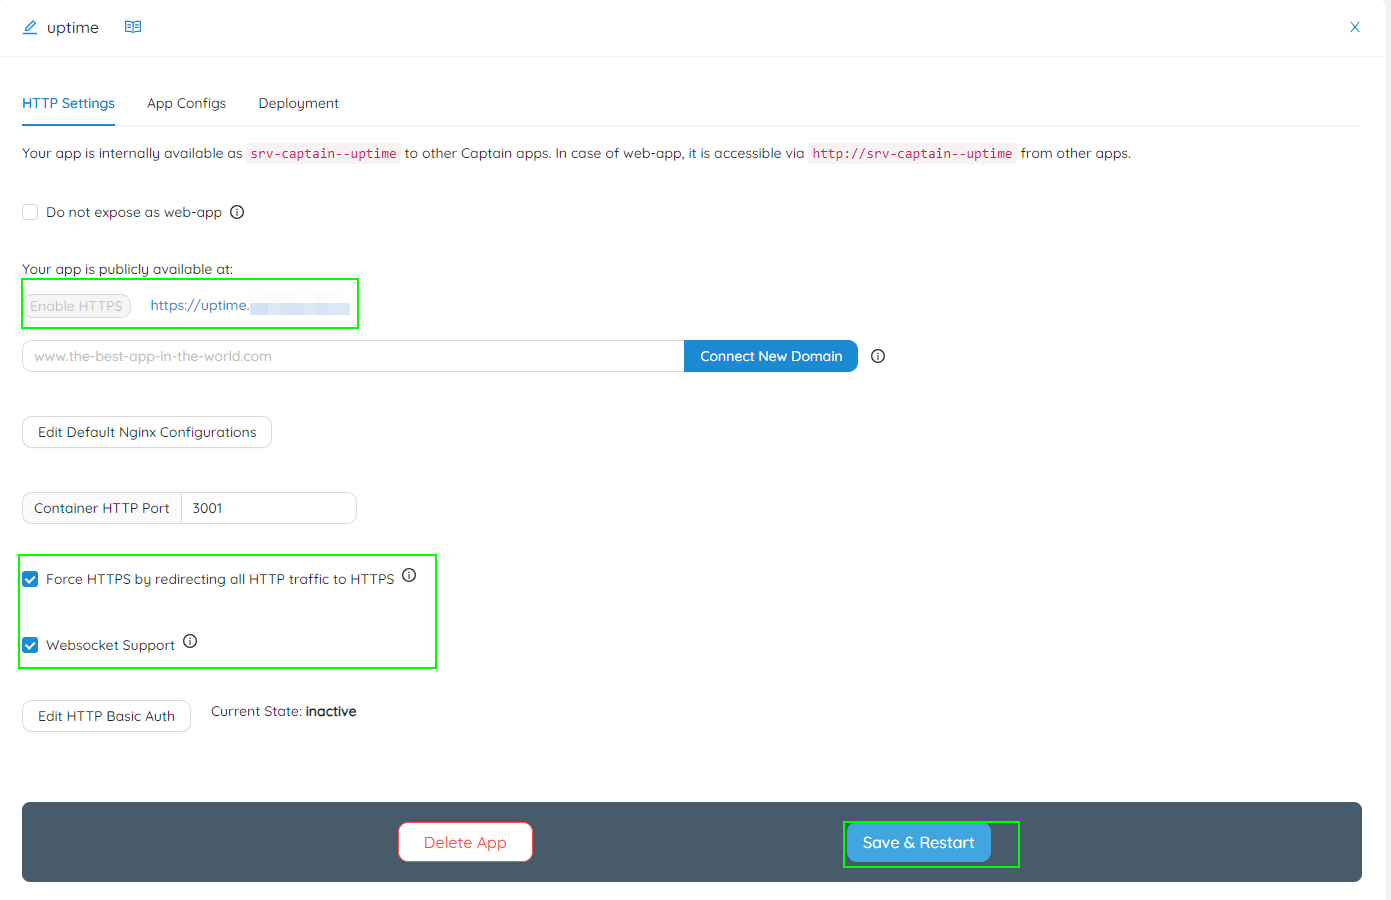
- Navigate to the app from the dashboard once it has been installed and make a few changes. First, enable HTTPS, and then force all HTTP traffic to be redirected to HTTPS. Also make sure you enable WebSocket support. Otherwise , uptime kuma will not work. Note that to access the dashboard, you will not need to append the port number as it was the case in the previous deployment methods.
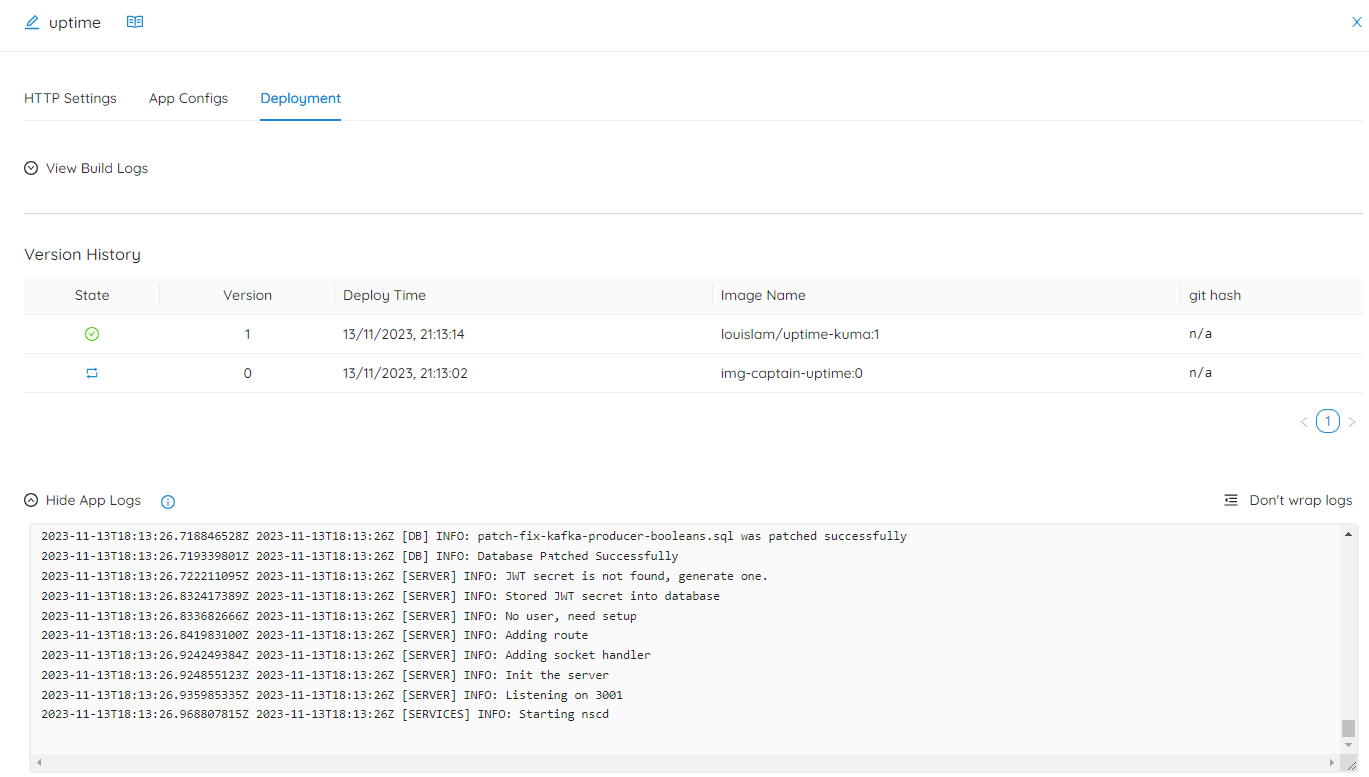
Wait for a few minutes before trying to access the dashboard. If you get a 404 error, it means the app is still being configured in the backend. You can monitor the status of the app via the deployments section
Deploying Uptime Kuma using Other methods
Uptime Kuma can also be deployed using other methods other than docker and on the cloud as described above. For example, you can deploy uptime kuma using Node JS and PM2 on any server, including windows hosts.
Although not fully tested, uptime kuma can also be deployed using OpenShift 4 and Kubernetes Helm 3 Chart. You can also automate the deoployments via Ansible. Feel free to check out the official deployment guide for the other supported methods of deploying uptime kuma.
For those who wish to expose ther uptime kuma server deployed in a home lab externally,
In order to expose Uptime Kuma to the web securely, it is recommended to proxy it behind a traditional webserver such as nginx or Apache. Unlike other web apps, Uptime Kuma is based on WebSocket. You need two more headers "Upgrade" and "Connection" in order to accept WebSocket on a reverse proxy. You can check out the full guide on how to configure reverse proxies using different services in the official guide of how to configure reverse proxies for Uptime Kuma.
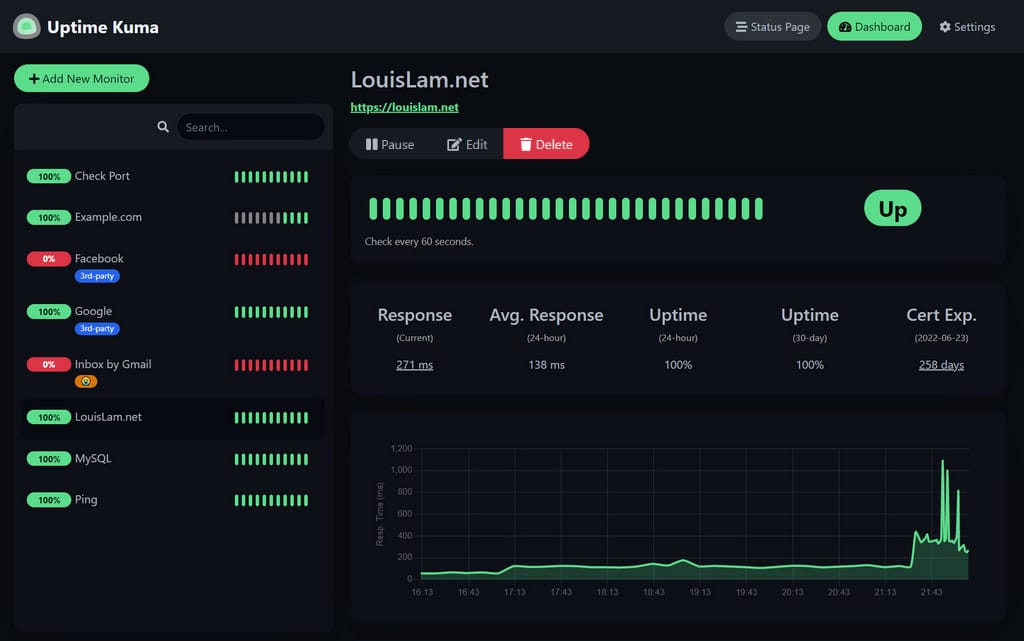
Accessing Uptime Kuma
Now that you have Uptime Kuma up and running, you can start exploring its monitoring capabilities. To access Uptime Kuma's web interface, open your browser and go to http://[IP]:3001 if you're using your home lab, or http://your-VPS-ip:3001 if you're using a VPS on the cloud. If you setup uptime kuma using Caprover, make sure to access the dashboard via the URL that appears on the dashboard. You should see a welcome screen that asks you to create an admin account. Enter your desired username and password, and click on "Create Account". You'll be taken to Uptime Kuma's dashboard, where you can add and manage your monitors.
Exploring Uptime Kuma's Monitoring Capabilities
Uptime Kuma supports various types of monitors that allow you to check the availability and performance of your websites, servers, and services. A monitor is a service that checks the status and performance of a website, server, or service at regular intervals.
Uptime Kuma supports several types of monitors: website monitor, HTTP monitor with keywords, DNS monitor, ICMP ping monitor, TCP port monitor and many more. Each monitor type serves different purposes and offers valuable insights into the health of your systems.
Let us explore some of the monitor types that Uptime Kuma offers:
Adding a Website Monitor
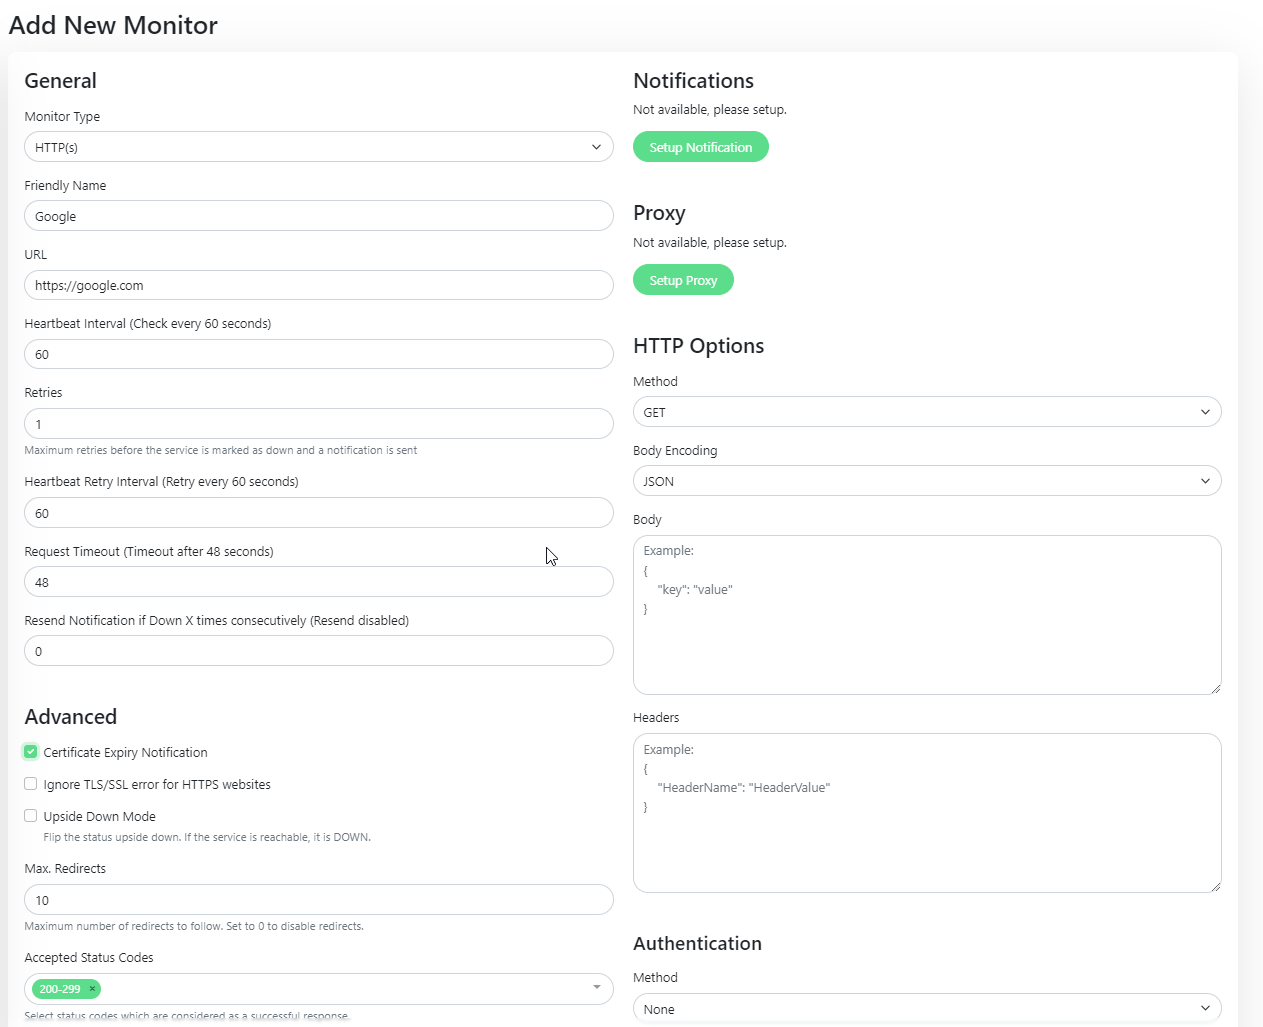
A website monitor is a simple monitor that checks if a website is up or down by sending a HTTP(s) request and expecting a response. To add a website monitor, click on the "Add Monitor" button on the dashboard, and select "HTTP(s)" as the monitor type.
You'll need to enter the URL of the website that you want to monitor, and optionally change the name, interval, timeout, and notification settings of the monitor. You can also enable advanced options such as HTTP method, headers, body, ignore TLS/SSL error, and follow redirect. The HTTP(s) monitor also checks for expiration dates of SSL certificates.
After saving the monitor, Uptime Kuma will start checking your website every few minutes (depending on your interval setting) and display the status on the dashboard. You'll can also set up uptime kuma to send notifications if your website goes down or up. We will cover that below.
HTTP Monitoring with Keywords
HTTP monitoring with keywords is a more advanced monitor that checks if a website contains a specific keyword or phrase in its response body. This is useful for verifying that your website is not only up, but also functioning properly.
To add an HTTP monitor with keywords, follow the same steps as adding a website monitor, but enable the "HTTP(s) Keyword" option under monitor type . You'll need to enter the keyword or phrase that you expect to find in your website's response body.
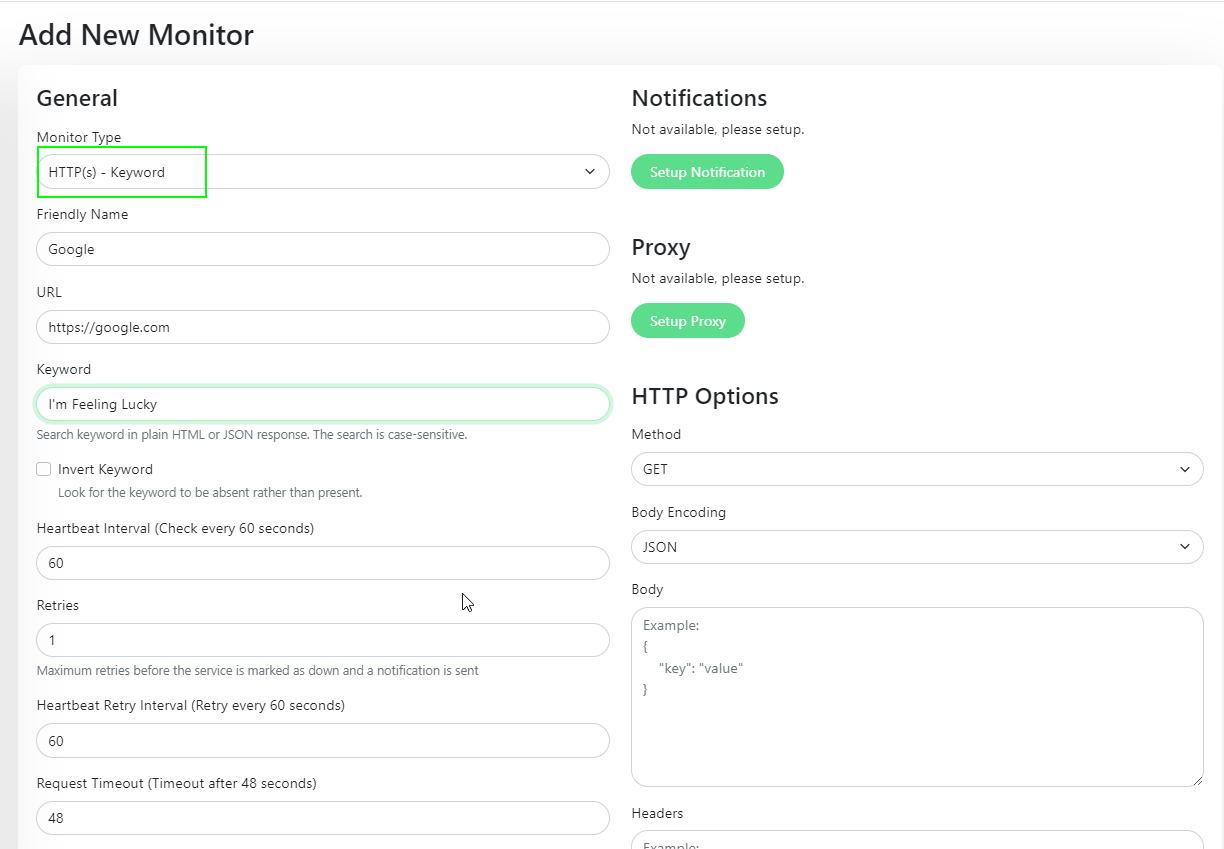
For example, if you want to monitor a blog post that contains the word "Uptime Kuma", you can enter "Uptime Kuma" as the keyword. Uptime Kuma will then check if your website's response body contains that word, and alert you if it doesn't.
DNS Monitoring
DNS monitoring can be useful, especially when making sure that custom DNS servers are working properly as expected.
To add a DNS monitor, follow the same steps as adding a website monitor, but select the the "DNS" option under monitor type . You'll need to enter a hostname that you will want to resolve and the DNS sever you want to monitor. this will vary depending on your scenario and can be either and internal or an external DNS server.
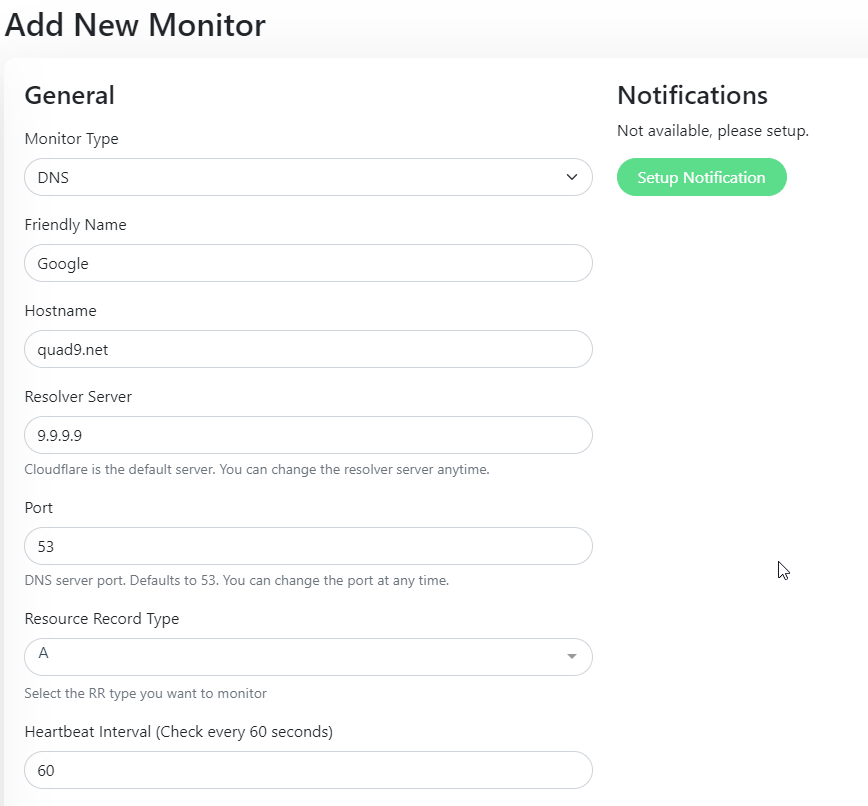
The DNS monitor can also be used for other DNS records. Check the resource record type drop down for more options.
ICMP Ping Monitoring
ICMP ping monitoring is a monitor that checks if a server or device responds to an ICMP ping request. This is useful for testing the basic connectivity and latency of your systems.
Of course uptime kuma can be used to monitor other services beyond HTTP, DNS and ICMP. Be sure to check out the other services to find one that can suit your needs.
Setting Up Notifications
One of the critical components is notifications, since you don't want to sit there the whole day looking at dashboards. Uptime Kuma by default has integrations with quite a number of notification providers, including social sites like slack and discord. Uptime kuma also supports Apprise which supports up to 78+ notification services. You can check out the full list of the supported provides on GitHub.
To get notified when services go down:
- Go to "Profile" > "Settings"
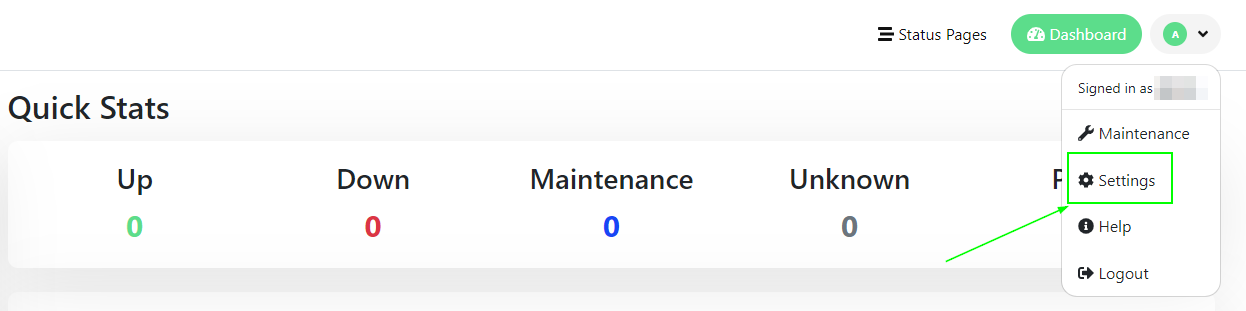
- Click "Notification" and then "Setup Notification"
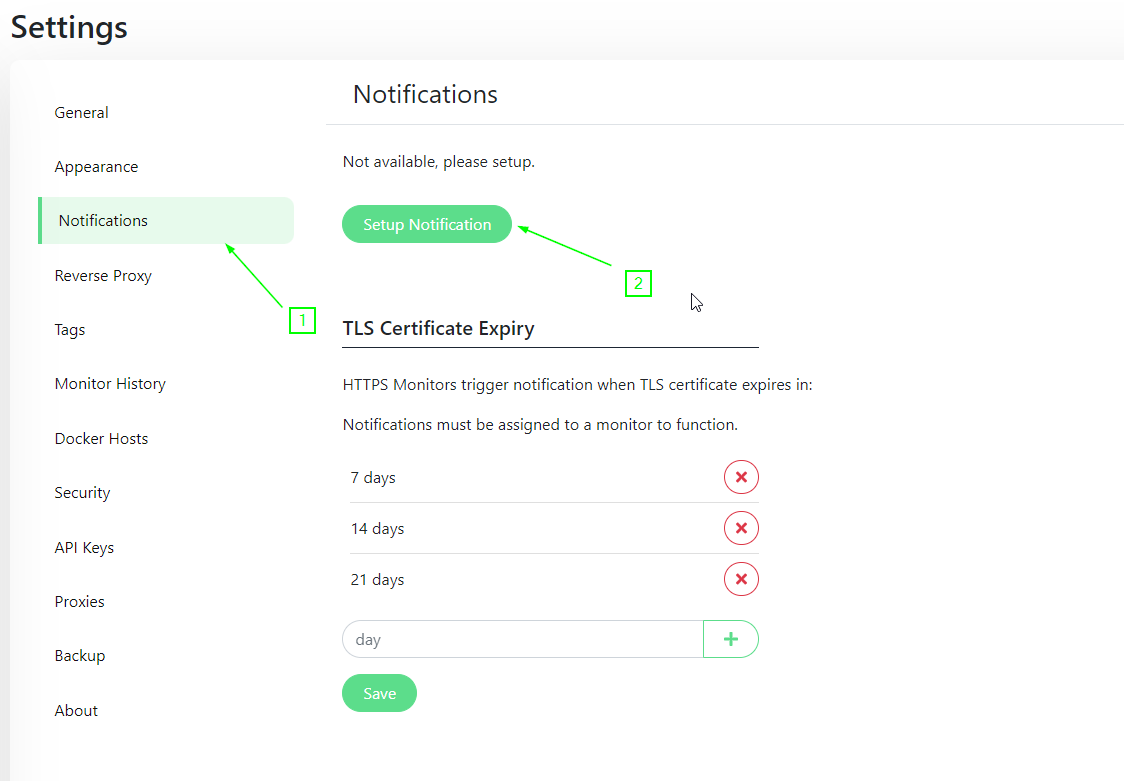
- Select notification service (Slack, Discord, Telegram etc)
- Configure call-back URL/webhook and other options depending on the method you choose. For example, here is one for slack
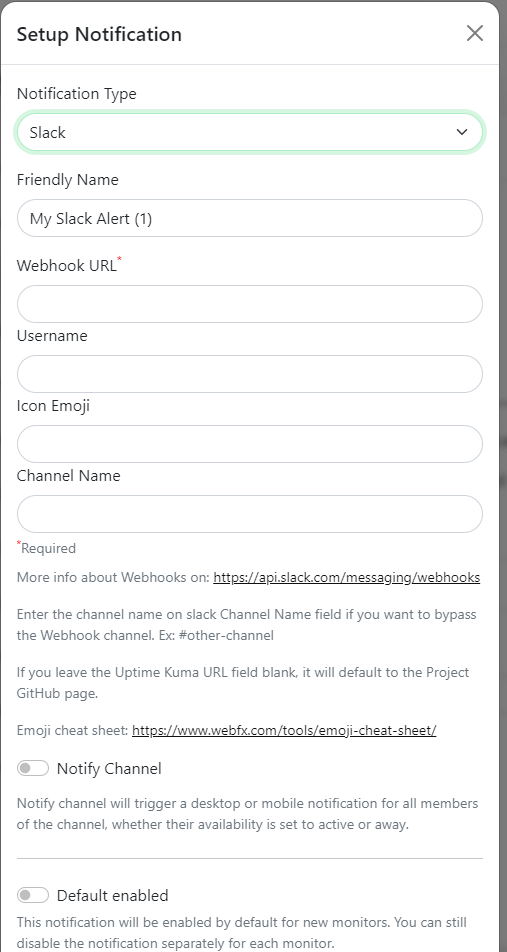
- Check "Enable for all monitors" to apply alerts globally
Test by bringing a monitor into a warning/critical state. The notification service should receive an alert.
Accessing Status Pages
Uptime Kuma includes a customizable status page to monitor service status at a glance:
- Go to "Status pages" and click "Add new status page"
- Add desired monitors/groups and customize layout
- Publish page
- Access public status page URL
This provides a dashboard overview that can be embedded on websites, dashboards, TVs and more.
And that covers the basic setup and configuration of Uptime Kuma! Let me know if you have any other questions.